Mitigating Extremal Risks: A Network-Based Portfolio Strategy - 中英对照阅读稿
--- title: "Mitigating Extremal Risks: A Network-Based Portfolio Strategy" aliases: - "缓解极端风险:一种基于网络的投资组合策略" - "arXiv:2409.12208" authors: - Qian Hui - Tiandong Wang source: "https://arxiv.org/abs/2409.12208" pdf: "2409.12208.pdf" created: 2026-07-16 type: paper-reader status: translated tags: - paper - arxiv - finance - extremal-risk - network-analysis - portfolio
Mitigating Extremal Risks: A Network-Based Portfolio Strategy - 中英对照阅读稿
Metadata
- Title: Mitigating Extremal Risks: A Network-Based Portfolio Strategy
- 中文题名: 缓解极端风险:一种基于网络的投资组合策略
- Authors: Qian Hui; Tiandong Wang
- Source read: arXiv:2409.12208 PDF (
2409.12208.pdf) - Version note: arXiv preprint; PDF creation date 2024-09-20
- Paper type: empirical/methodological finance paper combining extreme value theory, complex networks, graph algorithms, and portfolio optimization
Page / Section Index
| Section | Pages | Blocks |
|---|---|---|
| Abstract | 1 | S001 |
| 1 Introduction and data | 1-2 | S002-S006 |
| 2 Extremal dependence | 2-3 | S007-S011 |
| 3 Network model and portfolio strategy | 3-9 | S012-S025, T001-T002, F001-F006 |
| 4 Empirical study | 9-13 | S026-S037, T003-T008, F007-F009 |
| 5 Conclusions and references | 13-17 | S038-S040 |
Terminology Ledger
| Canonical term | First-use definition | 中文译名 | Decision |
|---|---|---|---|
| extremal risk | risk from market crashes or sharp tail losses | 极端风险 | 用于全文核心风险概念 |
| extremal dependence measure (EDM) | measure of simultaneous tail/extreme behavior | 极值依赖度量 | 首次写全称,后文用 EDM |
| multivariate regular variation (MRV) | regular variation of vector-valued distributions/measures | 多元正则变差 | 保留 MRV 缩写 |
| dependence network | graph built from pairwise EDM thresholding | 依赖网络 | 指股票收益极值依赖网络 |
| maximum independent set (MIS) | largest vertex set with no internal edges | 最大独立集 | MISP 译为最大独立集问题 |
| value at risk (VaR) | tail quantile risk measure | 风险价值 | 保留 VaR |
| expected shortfall (ES) | conditional tail loss beyond VaR | 期望损失 | 保留 ES |
| Girvan-Newman algorithm | community detection algorithm | Girvan-Newman 算法 | 简写 GN 算法 |
<a id="S001"></a>
Abstract
Source: p.1 S001
Original: In financial markets marked by inherent volatility, extreme events can result in substantial investor losses. This paper proposes a portfolio strategy designed to mitigate extremal risks. By applying extreme value theory, we evaluate the extremal dependence between stocks and develop a network model reflecting these dependencies. We use a threshold-based approach to construct this complex network and analyze its structural properties. To improve risk diversification, we utilize the concept of the maximum independent set from graph theory to develop suitable portfolio strategies. Since finding the maximum independent set in a given graph is NP-hard, we further partition the network using either sector-based or community-based approaches. Additionally, we use value at risk and expected shortfall as specific risk measures and compare the performance of the proposed portfolios with that of the market portfolio.
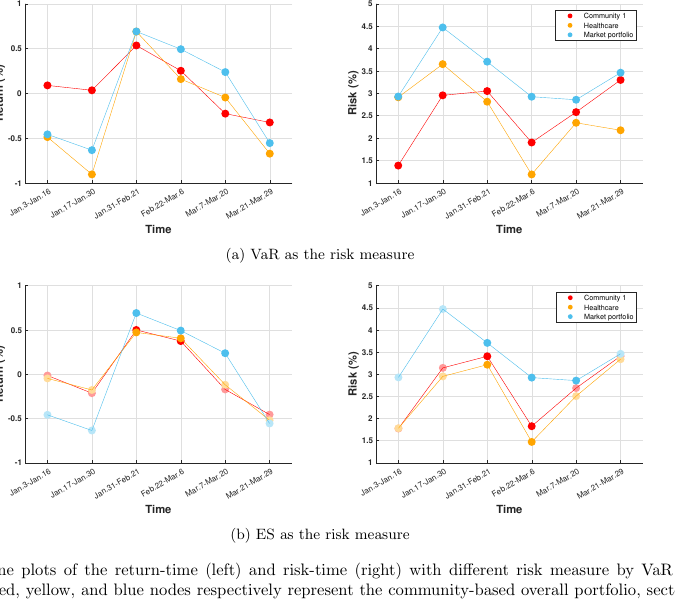
中文: 在天然波动的金融市场中,极端事件会给投资者造成重大损失。本文提出一种旨在缓解极端风险的投资组合策略。作者利用极值理论评估股票之间的极值依赖,并据此建立反映这些依赖关系的网络模型;随后采用阈值方法构造复杂网络并分析其结构性质。为了改进风险分散,论文把图论中的最大独立集概念引入投资组合构造。由于在给定图中寻找最大独立集是 NP-hard 问题,作者进一步按行业或网络社区对网络进行划分。最后,论文以风险价值(VaR)和期望损失(ES)作为风险度量,将所提组合与市场组合的表现进行比较。
<a id="S002"></a>
1 Introduction
Source: p.1 S002
Original: Financial markets are inherently volatile, leading to sudden and extreme fluctuations that can severely impact investor portfolios. These extreme events, such as market crashes or sharp downturns, present serious challenges to conventional risk management strategies. When modeling extremal risks, traditional correlation measures often fail in the presence of extremal dependence, as the second moment of a heavy-tailed random variable may not exist.
中文: 金融市场本身具有波动性,可能出现突然且剧烈的价格波动,并严重影响投资者组合。市场崩盘或急剧下跌等极端事件对传统风险管理策略构成挑战。在极端风险建模中,如果存在极值依赖,传统相关系数往往会失效,因为重尾随机变量的二阶矩可能并不存在。
<a id="S003"></a>
Source: p.1 S003
Original: Two popular ways to quantify extremal dependence are the extremal dependence measure (EDM) and extremograms. EDM quantifies the tendency of large values of components of a random vector to occur simultaneously, while the extremogram describes how extreme events at one time point relate to extreme events at another time point.
中文: 量化极值依赖的两种常用工具是极值依赖度量(EDM)和 extremogram。EDM 刻画随机向量不同分量的大值同时出现的倾向;extremogram 则描述一个时间点上的极端事件与另一个时间点上极端事件之间的关系。
<a id="S004"></a>
Source: p.1 S004
Original: The key question is how these tools can guide investors in constructing portfolios resilient to extremal losses. The study first quantifies pairwise extremal dependence to generate a dependence network of stock returns, and then applies graph tools to find a strategy for hedging against extremal risk.
中文: 核心问题是如何利用这些工具指导投资者构造能够抵御市场极端损失的投资组合。因此,本文首先量化股票收益两两之间的极值依赖,生成股票收益依赖网络;随后运用图论工具寻找对冲极端风险的策略。
<a id="S005"></a>
Source: p.1 S005
Original: In the constructed extremal dependence network, when there is no edge between two nodes, the corresponding stock returns are regarded as having low extremal dependence. The maximum independent set represents a group of stock returns with minimum extremal dependence, making them suitable for constructing diversified portfolios.
中文: 在构造出的极值依赖网络中,如果两个节点之间没有边,作者认为对应两只股票收益之间的极值依赖较低。最大独立集表示一组内部极值依赖最小的股票收益,因此适合用于构造更能抵御极端风险的分散化组合。
<a id="S006"></a>
1.1 Data example
Source: p.2 S006
Original: The authors use the R package quantmod to retrieve Yahoo Finance data on 113 Shenzhen constituent stocks from the CSI 300 in 2023. The trading period spans January 1 to December 31, 2023, with 242 trading days. Log returns are computed as r_i(t) = log P_i(t) - log P_i(t-1). Algorithm 1 computes log returns and pairwise EDM, constructs threshold networks, divides networks into clusters, solves each cluster's maximum independent set, and minimizes overall risk using VaR or ES.
中文: 作者使用 R 包 quantmod 从 Yahoo Finance 获取 2023 年沪深 300 中深圳成分股的 113 只股票数据。交易期为 2023 年 1 月 1 日至 12 月 31 日,共 242 个交易日。对数收益定义为 r_i(t) = log P_i(t) - log P_i(t-1)。算法 1 的流程是:计算对数收益和两两 EDM;构造阈值网络;按行业或社区等准则划分网络;求每个簇的最大独立集;再用 VaR 或 ES 最小化总体风险并输出最优组合。
<a id="S007"></a>
2 Extremal dependence between stock returns
Source: p.2-p.3 S007
Original: EDM quantifies the tendency for large values to occur simultaneously between two components. The paper introduces regular variation, M-convergence of measures on cones, and multivariate regular variation as the theoretical basis. A bivariate vector is normalized by a common scaling function, implying tail equivalence of marginal distributions.
中文: EDM 刻画两个分量的大值同时出现的倾向,本文把它作为构造股票收益网络结构的主要工具。论文先介绍正则变差、锥集上测度的 M-收敛以及多元正则变差,作为后续定义 EDM 的理论基础。二维随机向量用同一个尺度函数归一化,意味着边际分布在尾部等价。
<a id="S008"></a>
Source: p.3 S008
Original: For asymptotic dependence analysis, observations are transformed into polar coordinates and considered on the L2 unit sphere after thresholding by the L2 norm. The spectral measure on the positive unit sphere captures the directions in which extreme observations occur.
中文: 为了分析渐近依赖,作者在按 L2 范数设定阈值后,把观测值转换到极坐标,并在 L2 单位球面上考察其方向分布。正单位球面上的谱测度刻画极端观测出现的方向,也就是不同分量如何共同变大。
<a id="S009"></a>
Source: p.3 S009
Original: For a regularly varying bivariate random vector Z = [Z_1, Z_2]^T, EDM is defined as the integral of a_1 a_2 with respect to the spectral measure. EDM is 0 if and only if the coordinates are asymptotically independent; under a symmetric norm, EDM is maximized when the spectral measure is supported on the diagonal.
中文: 对于正则变差的二元随机向量 Z = [Z_1, Z_2]^T,EDM 定义为在正单位球面上对 a_1 a_2 关于谱测度积分。EDM 为 0 当且仅当两个坐标渐近独立;若范数具有对称性,则当谱测度支撑在对角线上时 EDM 达到最大值。
<a id="S010"></a>
Source: p.3 S010
Original: EDM can be interpreted as the limiting cross moment between normalized Z_1 and Z_2 conditional on a large radial component. The estimator averages products of normalized components over observations whose radius exceeds a threshold. Eq. (7) implies that EDM ranges from -0.5 to 0.5.
中文: EDM 也可以解释为在径向变量足够大时,归一化后的 Z_1 与 Z_2 的条件交叉矩极限。论文使用的估计量是在半径超过阈值的样本上,对两个归一化分量的乘积求平均。公式 (7) 表明 EDM 的取值范围为 [-0.5, 0.5]。
<a id="S011"></a>
Source: p.3 S011
Original: The next section constructs dependence networks among stock returns using EDM as the central feature.
中文: 下一节以 EDM 为核心特征构造股票收益之间的依赖网络。
<a id="S012"></a>
3 Stock network model based on extremal dependence
Source: p.3-p.4 S012
Original: The paper uses EDM to construct a network describing pairwise extremal dependence among stock returns. A complex network is denoted G = (V, E). The paper compares average degree, degree distribution, average path length, clustering coefficient, network diameter, and graph density under different thresholds.
中文: 论文使用 EDM 构造描述股票收益两两极值依赖的网络,记为 G = (V, E)。作者比较不同阈值下的平均度、度分布、平均路径长度、聚类系数、网络直径和图密度,以选择合适阈值。
<a id="S013"></a>
Source: p.4 S013
Original: Average degree measures overall connectivity; degree distribution can reveal scale-free behavior; average path length measures network communication distance; clustering coefficient measures local cohesion; network diameter is the maximum shortest-path distance; graph density is the ratio of actual to possible edges.
中文: 平均度衡量总体连接水平;度分布可揭示网络是否具有无标度特征;平均路径长度衡量网络中节点之间的平均距离;聚类系数衡量局部凝聚程度;网络直径是最远两点的最短路径距离;图密度是实际边数占可能边数的比例。
<a id="S014"></a>
3.2 Network construction based on threshold method
Source: p.5 S014
Original: Each stock is represented as a vertex. An edge exists between stocks i and j if i != j and EDM(i, j) >= theta; otherwise no edge is included. Higher thresholds create sparser networks.
中文: 每只股票被表示为一个顶点。当 i != j 且 EDM(i, j) >= theta 时,顶点 i 与 j 之间存在一条边;否则不存在边。因此,阈值 theta 越高,网络越稀疏。
<a id="T001"></a>
Table 1. 不同阈值下的网络参数比较
Placed near: p.5 S015 Source: p.5 T001
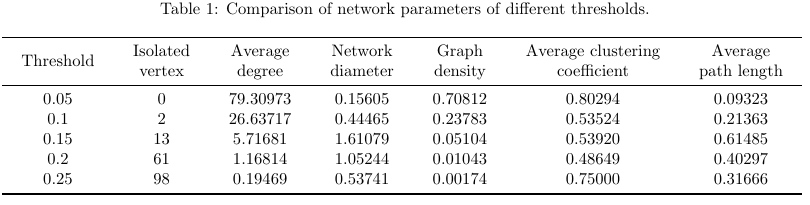
Original caption: Table 1: Comparison of network parameters of different thresholds.
中文表注: 表 1:不同阈值下网络参数的比较。
Reading note: theta = 0.15 时网络直径和平均路径长度达到峰值,同时没有像 0.2/0.25 那样产生过多孤立点。
<a id="S015"></a>
Source: p.5 S015
Original: The paper examines thresholds theta = 0.05, 0.1, 0.15, 0.2, 0.25. As theta increases, isolated vertices increase and edges decrease, lowering average degree. Diameter and average path length peak at theta = 0.15, then decline as isolated vertices disrupt network structure. Thresholds 0.2 and 0.25 are not further considered.
中文: 论文考察 theta = 0.05, 0.1, 0.15, 0.2, 0.25 五个阈值。随着 theta 增大,孤立顶点增多、边数减少、平均度下降。网络直径和平均路径长度在 theta = 0.15 时达到峰值;继续增大阈值时,大量孤立顶点破坏网络结构,因此 0.2 和 0.25 不再继续考虑。
<a id="F001"></a>
Figure 1. 不同阈值下度分布的 1-CDF 图
Placed near: p.5 S016 Source: p.6 F001/C001
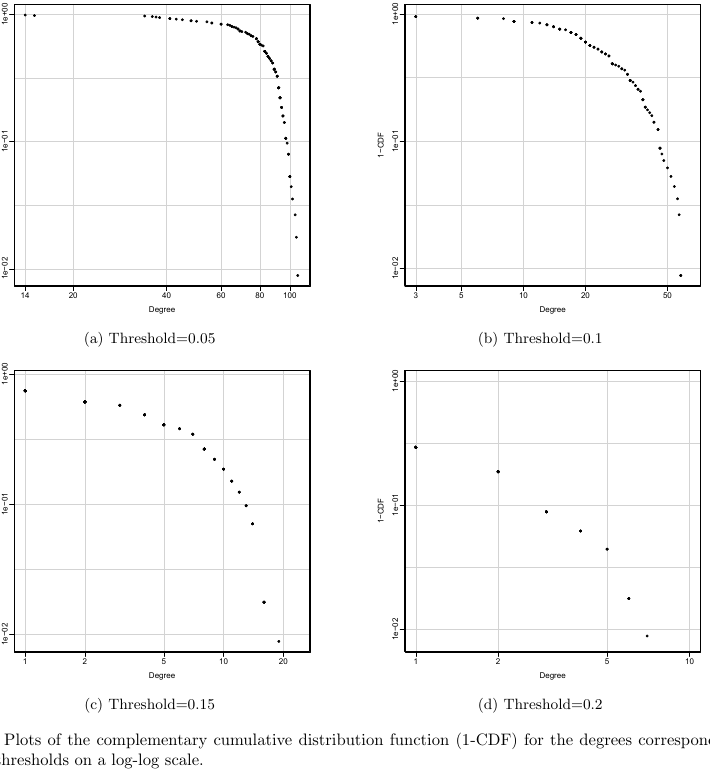
Original caption: Figure 1: Plots of the complementary cumulative distribution function (1-CDF) for the degrees corresponding to different thresholds on a log-log scale.
中文图注: 图 1:不同阈值下节点度的互补累积分布函数(1-CDF)在对数-对数坐标下的图。
<a id="S016"></a>
Source: p.5 S016
Original: For theta = 0.05 and 0.1, the degree distributions decay rapidly and show little evidence of scale-free structure. For theta = 0.15, the degree-tail distribution exhibits a power-law decay pattern. The authors therefore set theta = 0.15.
中文: 当 theta = 0.05 和 theta = 0.1 时,度分布快速衰减,几乎没有无标度特征;当 theta = 0.15 时,度分布尾部呈现幂律衰减模式。因此,作者选择 theta = 0.15 构造后续依赖网络。
<a id="F002"></a>
Figure 2. theta = 0.15 的依赖网络
Placed near: p.5 S017 Source: p.7 F002/C002
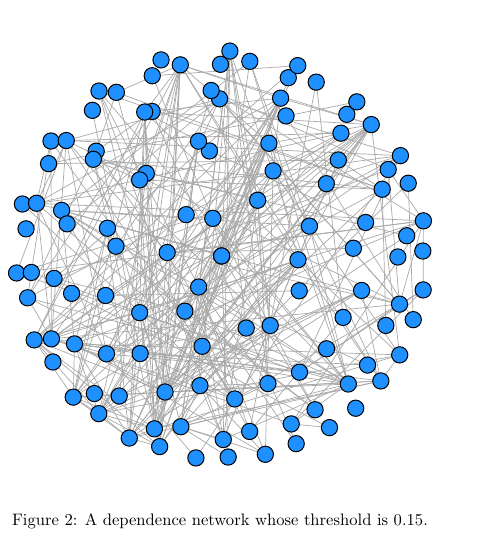
Original caption: Figure 2: A dependence network whose threshold is 0.15.
中文图注: 图 2:阈值为 0.15 的依赖网络。
<a id="S017"></a>
Source: p.5 S017
Original: With theta = 0.15, the network contains 113 vertices and EDM ranges from -0.041 to 0.5. If no edge is observed between nodes i and j, the corresponding stock returns are treated as asymptotically independent.
中文: 在 theta = 0.15 下,网络包含 113 个顶点,EDM 取值范围约为 -0.041 到 0.5。若节点 i 与 j 之间没有边,则对应两只股票收益被视为渐近独立。
<a id="S018"></a>
3.2.2 Maximum independent set
Source: p.5-p.6 S018
Original: The portfolio strategy identifies stocks with low extremal dependence by finding a maximum independent set. In an undirected graph, an independent set is a subset of vertices with no internal edges, and the maximum independent set is the largest among maximal independent sets. Since MISP is NP-hard, the paper uses the greedy algorithm in [20].
中文: 组合策略通过寻找最大独立集来识别极值依赖较低的股票。在无向图中,独立集是内部任意两点之间都没有边的顶点子集;最大独立集是规模最大的极大独立集。由于最大独立集问题是 NP-hard 的,论文采用文献 [20] 的贪心算法求可行解。
<a id="S019"></a>
3.3 Stock portfolio strategy based on complex networks
Source: p.7 S019
Original: The graph-based portfolio strategy partitions the network by sector-based and community-based methods. For each sub-network, graph algorithms identify the corresponding maximum independent set, which becomes the selected portfolio. VaR and ES are used to evaluate risk.
中文: 基于图的投资组合策略先用行业划分和社区划分两种方法拆分网络;随后在每个子网络中寻找最大独立集,并以此得到被选择的组合。论文使用 VaR 和 ES 评估风险。
<a id="T002"></a>
Table 2. 各行业对应股票数量
Placed near: p.7 S020 Source: p.7 T002
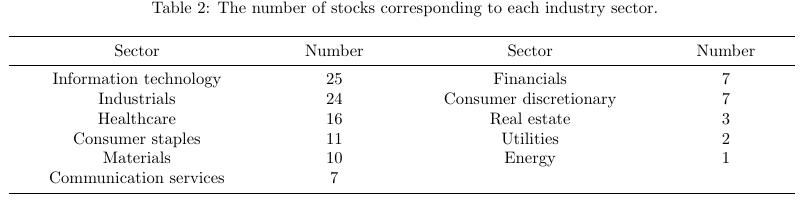
Original caption: Table 2: The number of stocks corresponding to each industry sector.
中文表注: 表 2:各行业部门对应的股票数量。
<a id="S020"></a>
3.3.1 Sector-based classification
Source: p.7-p.8 S020
Original: The 113 stocks are classified into 11 primary industry categories. Information technology, industrials, and healthcare are the three largest sectors by number of stocks. One might expect stocks in the same sector to cluster, but the visualized network does not support that expectation.
中文: 113 只股票被划分为 11 个一级行业。信息技术、工业和医疗保健是股票数量最多的三个行业。直觉上,同一行业股票可能会聚在一起,但网络可视化并不支持这一假设。
<a id="F003"></a>
Figure 3. 按行业着色的股票网络
Placed near: p.8 S020 Source: p.8 F003/C003
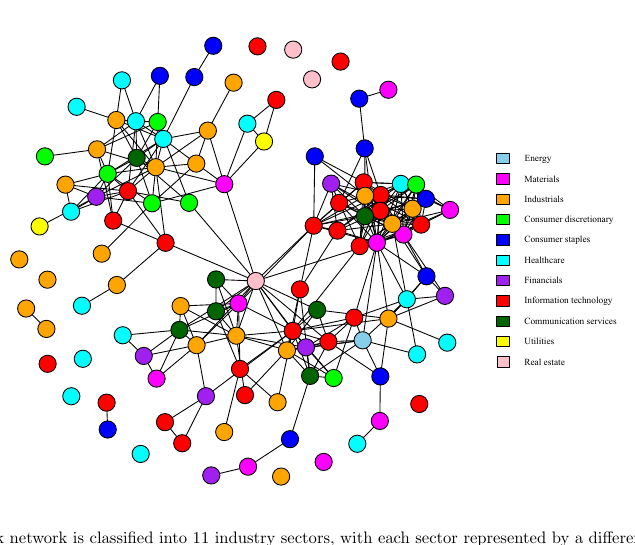
Original caption: Figure 3: A stock network is classified into 11 industry sectors, with each sector represented by a different color.
中文图注: 图 3:股票网络按 11 个行业部门分类,每个行业用不同颜色表示。
<a id="F004"></a>
Figure 4. 行业子网络中的最大独立集
Placed near: p.8 S021 Source: p.8 F004/C004
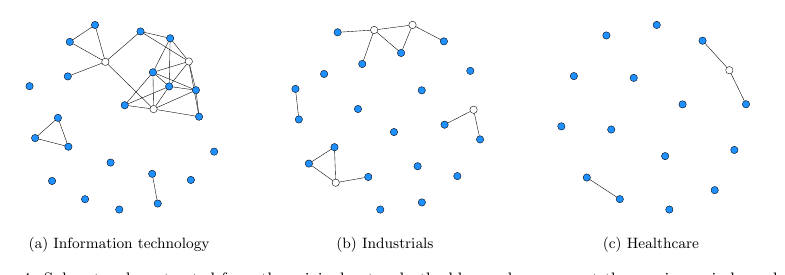
Original caption: Figure 4: Sub-networks extracted from the original network; the blue nodes represent the maximum independent set of results of the sub-network by sector.
中文图注: 图 4:从原始网络中提取的子网络;蓝色节点表示按行业划分的子网络最大独立集结果。
<a id="S021"></a>
Source: p.8 S021
Original: Sector extraction creates many isolated vertices, while the original network only has 13 isolated vertices. This suggests strong extremal dependence across sectors and indicates that sector-based partitioning ignores important cross-sector connections.
中文: 行业子网络提取后出现大量孤立顶点,而原始网络只有 13 个孤立顶点。这说明不同行业之间存在较强极值依赖,按行业切分会忽略重要的跨行业连接。
<a id="F005"></a>
Figure 5. 两个社区的示意网络
Placed near: p.9 S022 Source: p.9 F005/C005
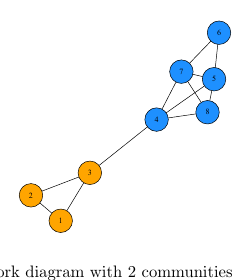
Original caption: Figure 5: A network diagram with 2 communities in different colours.
中文图注: 图 5:用不同颜色表示两个社区的网络示意图。
<a id="S022"></a>
3.3.2 Community detection based on GN algorithm
Source: p.9 S022
Original: Community structure means that certain vertices naturally form densely connected groups, with sparse connections between groups. The paper uses the Girvan-Newman algorithm to partition the dependence network into 21 communities, 13 of which are single-vertex isolated communities.
中文: 社区结构指某些顶点会自然形成内部连接密集的群组,而群组之间连接稀疏。论文采用 Girvan-Newman 算法把依赖网络划分为 21 个社区,其中 13 个社区是单顶点孤立社区。
<a id="F006"></a>
Figure 6. 按社区着色的股票网络
Placed near: p.9 S023 Source: p.10 F006/C006
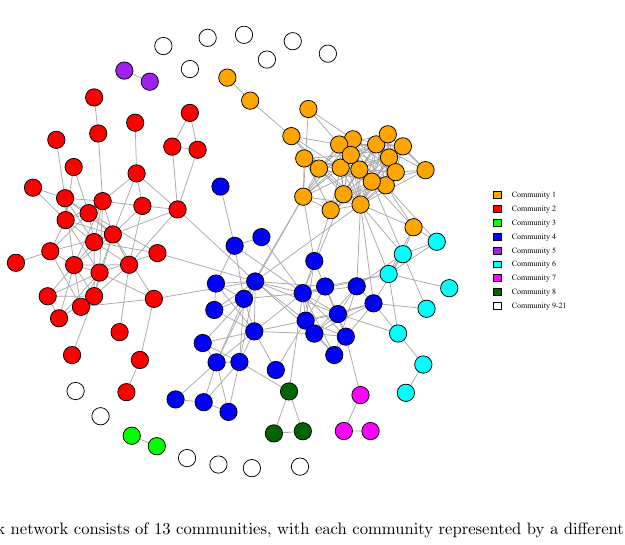
Original caption: Figure 6: The stock network consists of 13 communities, with each community represented by a different color.
中文图注: 图 6:股票网络由若干社区组成,每个社区用不同颜色表示。
Reading note: 正文称网络被分为 21 个社区,其中 13 个为孤立顶点;图注写作 13 communities,图例将 Community 9-21 合并显示。
<a id="S023"></a>
Source: p.9 S023
Original: Compared with the sector-colored graph, the community-colored graph displays a more organized pattern. Communities 1, 2, and 4 account for approximately 80% of the network. The paper focuses on these communities and finds their maximum independent sets.
中文: 与按行业着色的图相比,按社区着色的图呈现出更有组织的结构。社区 1、2 和 4 合计约占整个网络的 80%。因此,论文重点考察这三个社区并求解各自的最大独立集。
<a id="F007"></a>
Figure 7. 社区子网络中的最大独立集
Placed near: p.9 S023 Source: p.11 F007/C007
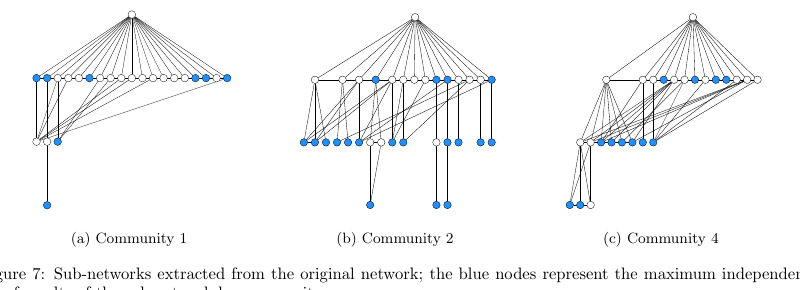
Original caption: Figure 7: Sub-networks extracted from the original network; the blue nodes represent the maximum independent set of results of the sub-network by community.
中文图注: 图 7:从原始网络中提取的子网络;蓝色节点表示按社区划分的子网络最大独立集结果。
<a id="S024"></a>
Source: p.9 S024
Original: Community-based classification is used as an alternative to sector-based classification in later portfolio construction.
中文: 后续组合构造中,基于社区的划分将作为基于行业划分的替代方案进行比较。
<a id="S025"></a>
Source: p.9 S025
Original: The key empirical question is whether maximum-independent-set portfolios reduce tail risk compared with a market portfolio.
中文: 关键实证问题是:与市场组合相比,基于最大独立集构造的组合是否能降低尾部风险。
<a id="S026"></a>
4 Empirical study and results
Source: p.9-p.10 S026
Original: The paper proposes a portfolio strategy to minimize extremal loss risk, using VaR and ES as risk measures. VaR at confidence level 1-alpha is defined by P(Delta P < -VaR) = alpha; ES is defined as E[L | L > VaR] and is coherent.
中文: 论文提出一种最小化极端损失风险的组合策略,并使用 VaR 与 ES 作为风险度量。在置信水平 1-alpha 下,VaR 满足 P(Delta P < -VaR) = alpha;ES 定义为 E[L | L > VaR],并且是一致风险度量。
<a id="S027"></a>
Source: p.10 S027
Original: The holding period is one day. VaR and ES are calculated at a 95% confidence level. The optimization minimizes overall risk subject to weights summing to 1, each weight lying between 0 and 0.3, and the target total return being at least 1.15%.
中文: 论文假设持有期为 1 天,并在 95% 置信水平下计算每只股票的 VaR 和 ES。优化目标是最小化组合总体风险,约束包括权重和为 1、单个权重在 0 到 0.3 之间,以及总收益率至少达到 1.15%。
<a id="T003"></a>
Table 3. 社区 1 最大独立集的 VaR 与 ES
Placed near: p.10 S028 Source: p.11 T003
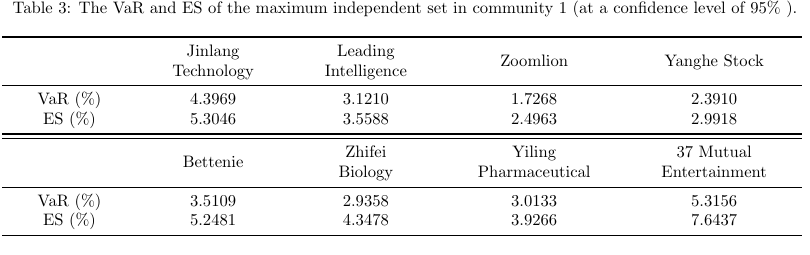
Original caption: Table 3: The VaR and ES of the maximum independent set in community 1 (at a confidence level of 95%).
中文表注: 表 3:社区 1 最大独立集的 VaR 和 ES(置信水平 95%)。
<a id="T004"></a>
Table 4. 医疗保健行业最大独立集的 VaR 与 ES
Placed near: p.10 S028 Source: p.12 T004
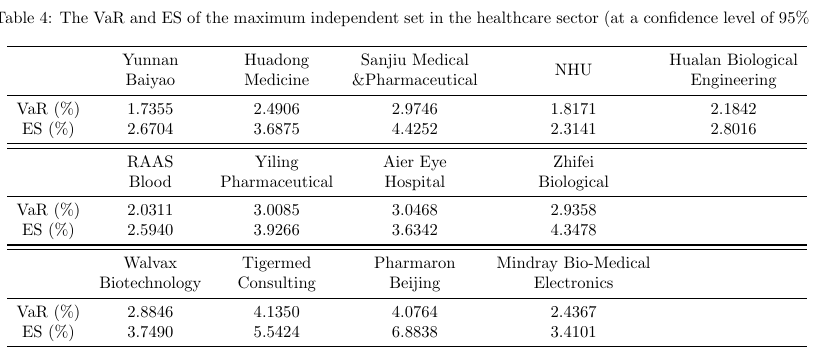
Original caption: Table 4: The VaR and ES of the maximum independent set in the healthcare sector (at a confidence level of 95%).
中文表注: 表 4:医疗保健行业最大独立集的 VaR 和 ES(置信水平 95%)。
<a id="S028"></a>
4.2 Local portfolio analysis
Source: p.10-p.11 S028
Original: Community 1 and the healthcare sector are used as representative local portfolios. The minimization problem is solved using MATLAB linprog. ES values are consistently larger than VaR values because ES is the expected loss conditional on exceeding VaR.
中文: 作者选取社区 1 和医疗保健行业作为局部组合代表,并用 MATLAB 的 linprog 求解最小化问题。ES 数值普遍大于 VaR,因为 ES 表示损失超过 VaR 条件下的期望损失。
<a id="T005"></a>
Table 5. 社区 1 最大独立集的最小风险最优组合
Placed near: p.11 S029 Source: p.12 T005
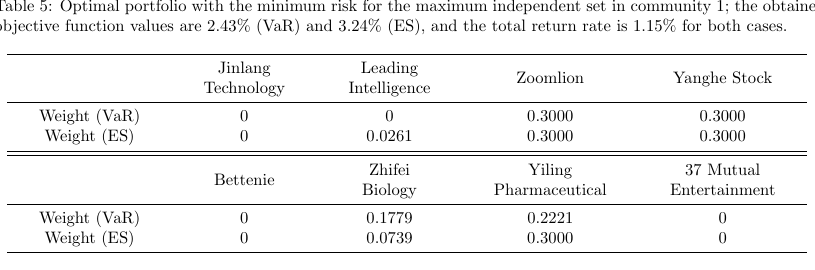
Original caption: Table 5: Optimal portfolio with the minimum risk for the maximum independent set in community 1; the obtained objective function values are 2.43% (VaR) and 3.24% (ES), and the total return rate is 1.15% for both cases.
中文表注: 表 5:社区 1 最大独立集上的最小风险最优组合;目标函数值分别为 2.43%(VaR)和 3.24%(ES),两种情况下总收益率均为 1.15%。
<a id="T006"></a>
Table 6. 医疗保健行业最大独立集的最小风险最优组合
Placed near: p.11 S029 Source: p.13 T006
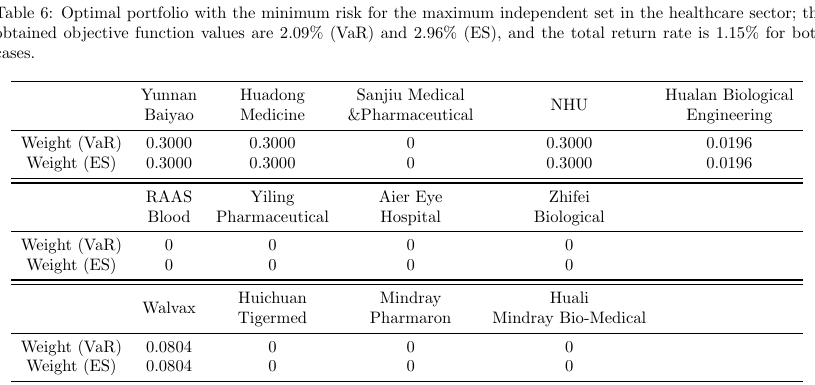
Original caption: Table 6: Optimal portfolio with the minimum risk for the maximum independent set in the healthcare sector; the obtained objective function values are 2.09% (VaR) and 2.96% (ES), and the total return rate is 1.15% for both cases.
中文表注: 表 6:医疗保健行业最大独立集上的最小风险最优组合;目标函数值分别为 2.09%(VaR)和 2.96%(ES),两种情况下总收益率均为 1.15%。
<a id="S029"></a>
Source: p.11 S029
Original: In both local examples, VaR and ES lead to similar exclusion decisions. In healthcare, both measures produce identical weights. In community 1, ES reduces the allocation to Zhifei Biology and increases allocation to Leading Intelligence and Yiling Pharmaceutical because Zhifei Biology's ES is much larger than its VaR.
中文: 在两个局部例子中,VaR 和 ES 对“哪些股票不纳入组合”的判断基本一致。医疗保健行业中,两种风险度量给出相同权重。社区 1 中,ES 会降低智飞生物权重,并提高先导智能和以岭药业权重,因为智飞生物的 ES 明显高于其 VaR。
<a id="F008"></a>
Figure 8. 局部组合与市场组合的收益-风险比较
Placed near: p.11 S030 Source: p.14 F008/C008
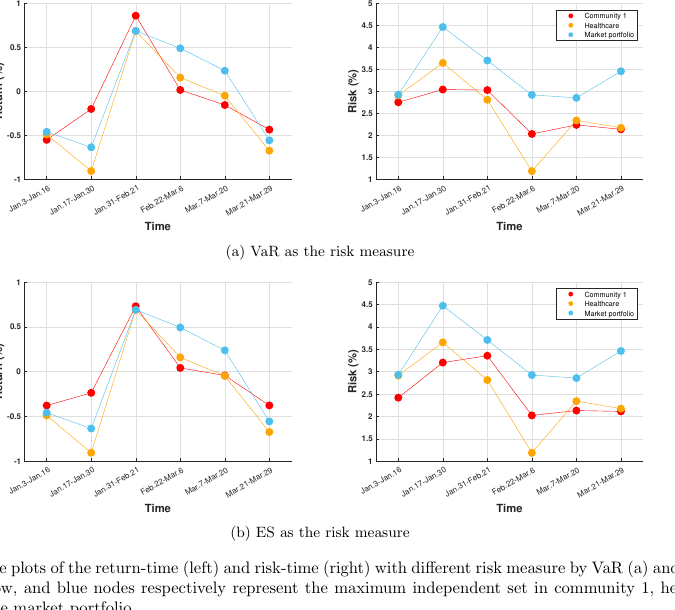
Original caption: Figure 8: Line plots of the return-time (left) and risk-time (right) with different risk measure by VaR (a) and ES (b); the red, yellow, and blue nodes respectively represent the maximum independent set in community 1, healthcare sector and the market portfolio.
中文图注: 图 8:使用 VaR (a) 和 ES (b) 作为风险度量时,收益-时间图(左)和风险-时间图(右);红、黄、蓝分别表示社区 1 最大独立集、医疗保健行业和市场组合。
<a id="S030"></a>
Source: p.11 S030
Original: Stock prices from January 1 to March 31, 2024 are divided into six 10-trading-day windows. In all windows, the maximum-independent-set strategies reduce risk relative to the market portfolio. During Jan 17-30, 2024, community 1 has higher return and lower risk than the market portfolio.
中文: 作者将 2024 年 1 月 1 日至 3 月 31 日的股票价格分为六个 10 个交易日窗口。所有窗口中,最大独立集策略相较市场组合都降低了风险。尤其在 2024 年 1 月 17 日至 1 月 30 日,社区 1 组合比市场组合收益更高、风险更低。
<a id="S031"></a>
4.3 Overall portfolio analysis
Source: p.11-p.12 S031
Original: Because maximum-independent-set portfolios outperform the market portfolio locally, the paper extends the strategy to the whole market. Directly solving MIS on the entire network is infeasible, so MIS is solved within sector or community partitions and then aggregated for portfolio optimization.
中文: 由于局部最大独立集组合相较市场组合表现更优,论文进一步将策略扩展到整体市场。直接在整个网络上求解 MIS 不可行,因此作者先在行业或社区子网络内求 MIS,再汇总这些股票进行组合优化。
<a id="T007"></a>
Table 7. 基于行业的整体股票最小风险组合
Placed near: p.12 S032 Source: p.13 T007
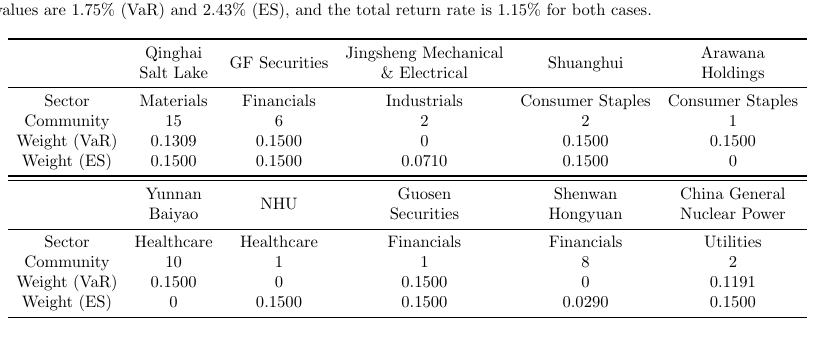
Original caption: Table 7: Optimal portfolio with the minimum risk for the sector-based overall stocks; the obtained objective function values are 1.75% (VaR) and 2.43% (ES), and the total return rate is 1.15% for both cases.
中文表注: 表 7:基于行业划分的整体股票最小风险最优组合;目标函数值分别为 1.75%(VaR)和 2.43%(ES),两种情况下总收益率均为 1.15%。
<a id="T008"></a>
Table 8. 基于社区的整体股票最小风险组合
Placed near: p.12 S033 Source: p.15 T008
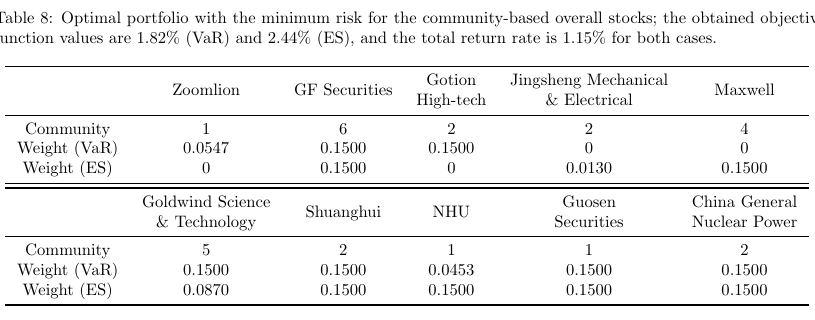
Original caption: Table 8: Optimal portfolio with the minimum risk for the community-based overall stocks; the obtained objective function values are 1.82% (VaR) and 2.44% (ES), and the total return rate is 1.15% for both cases.
中文表注: 表 8:基于社区划分的整体股票最小风险最优组合;目标函数值分别为 1.82%(VaR)和 2.44%(ES),两种情况下总收益率均为 1.15%。
<a id="S032"></a>
Source: p.12-p.13 S032
Original: For sector-based classification, MIS is solved for each of the 11 sectors and aggregated. Table 7 reports VaR/ES weights with sector and community labels. Stocks with zero weight are not shown. Three stocks belong to community 1 and another three to community 2.
中文: 对基于行业的划分,作者分别对 11 个行业求最大独立集并汇总。表 7 报告了基于 VaR/ES 的权重以及行业和社区标签,权重为零的股票未展示。结果显示有三只股票属于社区 1,另有三只属于社区 2。
<a id="S033"></a>
Source: p.12 S033
Original: For community-based classification, MIS is solved for all 21 communities and aggregated. Table 8 reports the corresponding weights. The paper then compares this strategy with the sector-based overall portfolio and the market portfolio.
中文: 对基于社区的划分,作者对全部 21 个社区求最大独立集并汇总。表 8 报告相应权重。随后,论文比较该策略、基于行业的整体组合和市场组合。
<a id="F009"></a>
Figure 9. 整体组合与市场组合的收益-风险比较
Placed near: p.12 S034 Source: p.16 F009/C009
Original caption: Figure 9: Line plots of the return-time (left) and risk-time (right) with different risk measure by VaR (a) and ES (b); the red, yellow, and blue nodes respectively represent the community-based overall portfolio, sector-based overall portfolio and the market portfolio.
中文图注: 图 9:使用 VaR (a) 和 ES (b) 作为风险度量时,收益-时间图(左)和风险-时间图(右);红、黄、蓝分别表示基于社区的整体组合、基于行业的整体组合和市场组合。
<a id="S034"></a>
Source: p.12 S034
Original: Figure 9 shows that the community-based overall portfolio has a significant advantage, especially during downside markets such as Jan 3-16, Jan 17-30, and Mar 21-29, 2024. It has a more stable return profile than the sector-based and market portfolios.
中文: 图 9 显示,基于社区的整体组合具有明显优势,尤其是在 2024 年 1 月 3-16 日、1 月 17-30 日和 3 月 21-29 日等市场下行期间。它的收益表现也比基于行业的组合和市场组合更稳定。
<a id="S035"></a>
Source: p.12-p.13 S035
Original: The sector-based overall portfolio also has lower risk than the market portfolio. With ES, sector- and community-based strategies perform similarly. With VaR, sector-based returns are more volatile and fail to avoid extremal risk during negative market periods.
中文: 基于行业的整体组合风险也低于市场组合。使用 ES 时,行业策略和社区策略表现相近;但使用 VaR 时,行业组合收益波动更大,在市场为负收益的时期未能有效规避极端风险。
<a id="S036"></a>
Source: p.13 S036
Original: A possible explanation is that sector partitioning creates excessive isolated nodes, so the resulting independent set may include stocks that actually belong to the same network community, increasing underlying extremal risk. Community-based partitioning reduces this issue.
中文: 可能的解释是,按行业划分会产生过多孤立点,使得到的独立集可能包含实际属于同一网络社区的股票,从而增加潜在极值风险。基于社区的划分能更好地缓解这一问题。
<a id="S037"></a>
Source: p.13 S037
Original: For investors seeking greater returns and willing to tolerate higher risk, the concentrated local portfolio may be preferable. For risk-averse investors who prioritize stability, the community-based overall portfolio is recommended.
中文: 对于追求更高潜在收益且能够承受较高风险的投资者,投资更集中的局部组合可能更合适。对于重视稳定性的风险厌恶型投资者,论文建议采用基于社区的整体组合。
<a id="S038"></a>
5 Conclusions
Source: p.13-p.14 S038
Original: The paper aims to provide investors with a portfolio that minimizes exposure to extremal risks. It uses EDM to quantify extremal dependence between stocks and represents the dependence structure as a network. The method is tested using 113 Shenzhen stocks from the CSI 300.
中文: 本文旨在为投资者提供一种能够最小化极端风险暴露的投资组合。论文使用 EDM 量化股票之间的极值依赖,并把整体依赖结构表示为网络。作者用沪深 300 中 113 只深圳成分股验证了所提策略。
<a id="S039"></a>
Source: p.14 S039
Original: Each stock is a vertex, a threshold-based method constructs the dependence network, and sector/community partitioning is compared. The maximum independent set within each sector or community is used for portfolio optimization by minimizing VaR or ES. Future work may broaden data selection and include practical factors such as market impact, dividends, foreign exchange rates, and refined stock categories.
中文: 在该方法中,每只股票是一个顶点,阈值方法用于构造依赖网络,并比较行业划分与社区划分。每个行业或社区内的最大独立集被用于以 VaR 或 ES 最小化为目标的组合优化。未来工作可以扩大数据范围,并纳入市场冲击、分红、汇率以及更细致股票类别等现实因素。
<a id="S040"></a>
References
Source: p.14-p.17 S040
Original: The paper cites 28 references covering coherent risk measures, regular variation, extremal dependence, financial tail risk, community detection, maximum independent set algorithms, financial networks, VaR, and complex networks.
中文: 论文共引用 28 篇文献,覆盖一致风险度量、正则变差、极值依赖、金融尾部风险、社区检测、最大独立集算法、金融网络、VaR 和复杂网络等主题。参考文献条目本身保留英文原格式,见原 PDF 第 14-17 页。
阅读提示 / Critical Reading Notes
- 核心贡献: 论文把 EDM 估计得到的极值依赖关系转化为股票网络,并用最大独立集寻找低尾部依赖股票组合。
- 阈值选择:
theta = 0.15是实证上选出的关键阈值,理由是网络仍有结构,同时度分布尾部接近幂律。 - 行业 vs 社区: 行业划分会割裂跨行业极值依赖,导致大量孤立点;社区划分更贴合网络结构,因此整体组合更稳健。
- VaR 与 ES: ES 对尾部损失更敏感;社区 1 中 Zhifei Biology 的配置差异体现了 ES 相比 VaR 的额外尾部惩罚。
- 实证范围: 数据仅覆盖 2023 年构网和 2024 年第一季度检验;结论仍需要跨年份、跨市场和交易成本/流动性约束检验。
Extraction Notes
- PDF 文本层可选,但部分希腊字母、数学符号和作者脚注在
pdfplumber/Poppler 抽取中出现编码损坏;本稿在上下文明确处恢复为theta,alpha,mu,Delta t,<=,>=等常规记号。 - 图表资产按渲染页面裁剪,属于近似裁剪;图注与正文独立翻译。
- Figure 6 的正文称 GN 算法将网络划分为 21 个社区,其中 13 个为单顶点社区;图注写作 13 communities,图例将 Community 9-21 合并显示。本稿按正文解释并记录该不一致。
- 本稿保留论文结构和关键原文段落;参考文献条目未逐条全文翻译,改为按主题说明并保留原 PDF 作为条目来源。